HTTP Probe Reachability Detection Plugin
The http-probe plugin is designed to leverage the reachability detection APIs that were introduced in the SSR as of 5.2.0 version of software. More documentation on the core product feature can be found here
The instructions for installing and managing the plugin can be found here.
Overview
Once installed and configured properly, the plugin will do the following operations on the router.
- Launch a set of HTTP(s) monitor services which will probe the configured HTTP or HTTPs URL at the configured frequency
- Periodically update the load-balancer APIs with the up/down status on service-paths associated with the http-probes
For HTTPS probes, the client will allow self-signed certificates for inspecting the reachability status of the service.
Configuration Snippet
The plugin leverages the existing SSR reachability detection and enforcement configuration within the service-route on the router.
HTTP Probe Profile configuration
- Config Path: authority > router[name] > http-probe-profile
- Config Fields:
| Name | Type | Constraints | Description |
|---|---|---|---|
| name | string | key | The name of the http probe profile |
| url | string | max: 2048 | A valid http or https URL to be used for availability checking |
| probe-interval | uint32 | default: 10 | The duration (in seconds) of how often to perform a link test to the destination |
| number-of-attempts | uint32 | default: 4 | The number of consecutive HTTP(s) requests to be sent within the probe-duration before deciding that destination is unreachable |
| probe-duration | uint32 | default: 5 | The duration (in seconds) within which to reach the destination. Each attempt will be made in (probe-duration / number-of-attempts) interval |
| valid-status-code | list | at least 1 value required | The list of valid status codes to be expected from the server |
| sla | container | optional | SLA requirements for http probe. See SLA for more information. |
| up-delay-timer | uint32 | default: 0 | The duration (in seconds) a probe is held down before transitioning from down to up state |
| proxy-settings | container | optional | Proxy settings if choosing to use proxy. See Proxy Settings for more information. |
- Example:
config

    authority

        router  my-router
            name                my-router

            http-probe-profile  http-probe-1
                name               http-probe-1
                url                http://172.16.2.5:5060/
                probe-interval     60
                number-of-attempts 5
                probe-duration     20
                valid-status-code  202
                valid-status-code  200
            exit
        exit
    exit
exit
Above configuration runs http probe as follow:
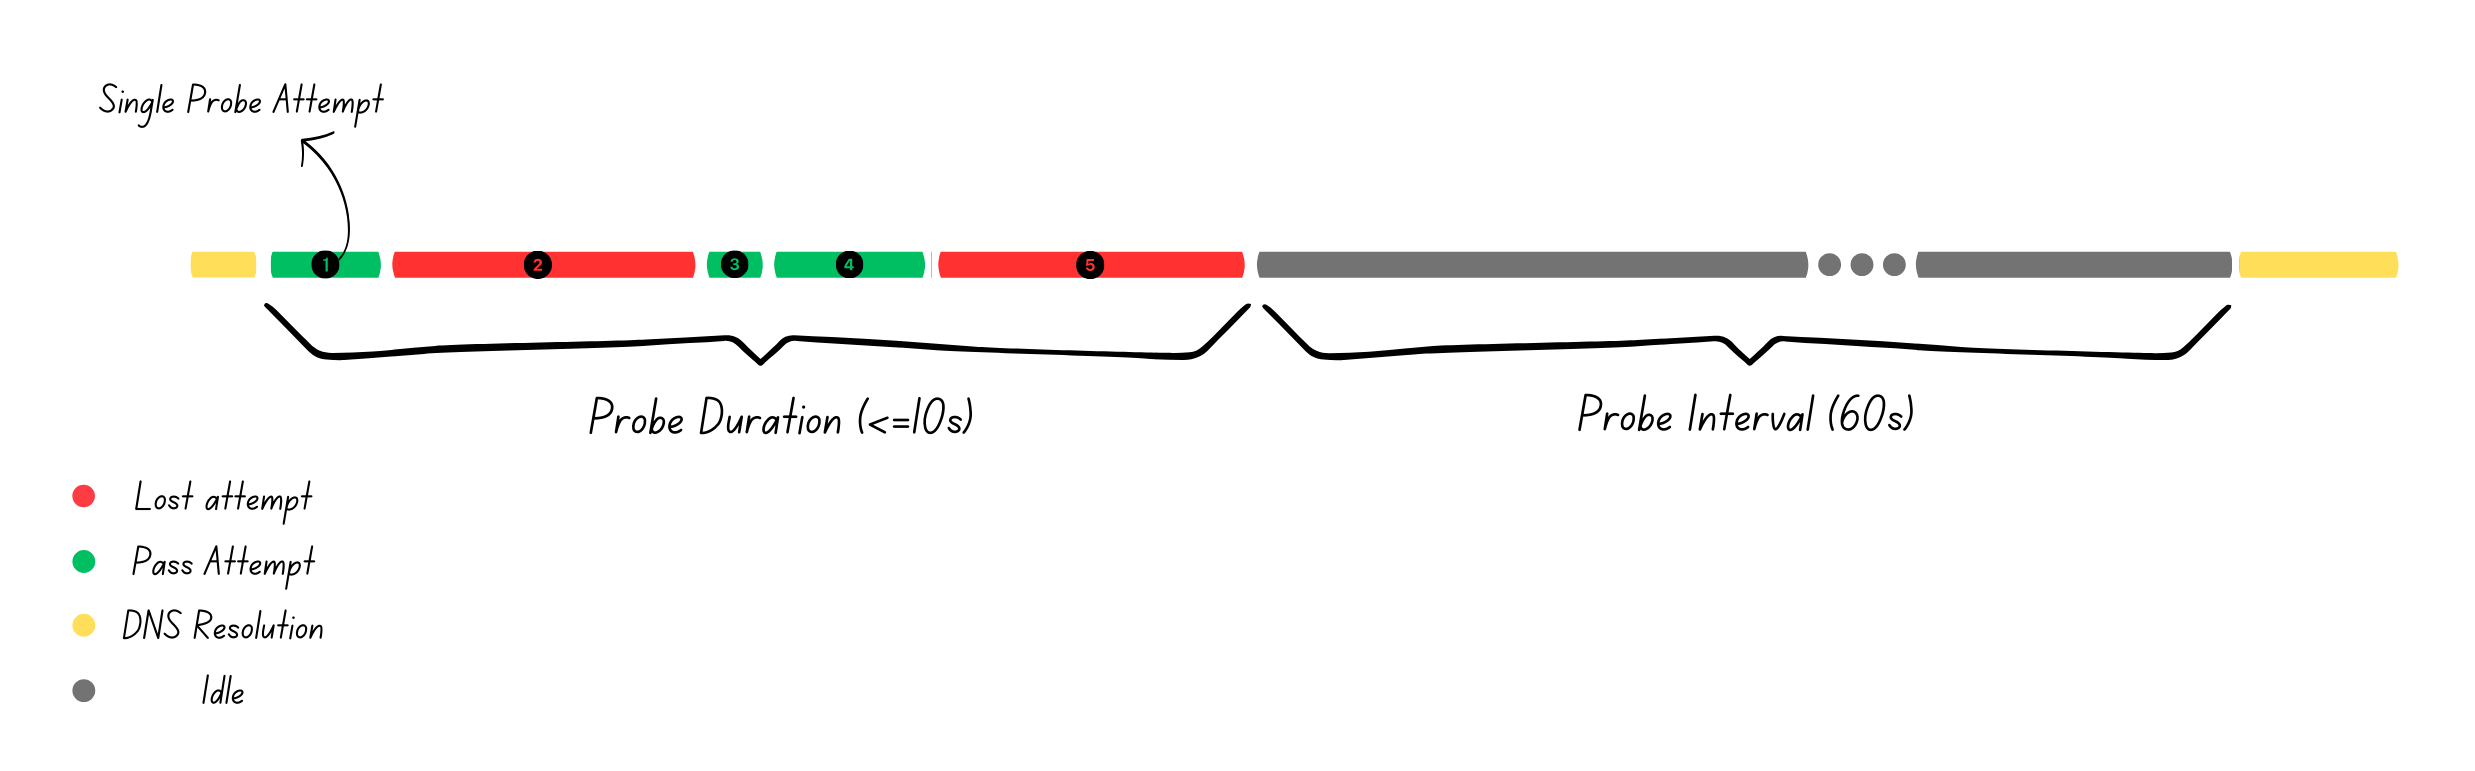 Based on the configuration, every test runs five probe attempts. Each attempt runs with a two second hard timeout, calculated by the
 probe-duration divided by the number-of-attempts. Each probe may fail due to a request failure, timeout reached, or an invalid response code. Service path status is determined at the end of the probe duration and the current status will remain until the end of the next test.
Each router can configure up to 10 http probe profiles.
SLA
Version History
| Release | Modification |
|---|---|
| 1.2.0 | http-probe-profile > sla introduced |
SLA can be configured to add additional criteria to determine probe test success. The result of a probe test is based on number of probe attempts defined in the http probe profile configuration. Certain validations are applied to SLA configuration. max-loss should be less than number-of-attempts, max-jitter and average-rtt should be less than the single probe timeout calculated by probe-duration / number-of-attempts.
The below example sets SLA on the probe test; with these settings, the test will be triggered every 10 seconds, 3 probes with a single probe timeout of 2 seconds will be applied and max-loss of 2 is considered for every test.
router
    http-probe-profile      http-probe-1
        name                http-probe-1
        url                 http://172.16.2.5:5060/
        valid-status-code   202
        valid-status-code   200
        probe-duration      6
        probe-interval      10
        number-of-attemps   3
        sla
            max-loss       2
        exit
    exit
exit
- Example:
router
    http-probe-profile  http-probe-1
        sla
            max-jitter     300
            max-loss       2
            average-rtt    200
        exit
    exit
exit
| Name | Type | Description |
|---|---|---|
| max-jitter | uint32 | Maximum difference between the maximum and minimum RTT of the HTTP probe in milliseconds |
| average-rtt | unit32 | Maximum average RTT for an HTTP probe test to be up in milliseconds |
| max-loss | unit8 | Number of failed HTTP(s) probe requests to mark the test down |
Proxy Settings
Version History
| Release | Modification |
|---|---|
| 2.3.0 | http-probe-profile > proxy-settings introduced |
Proxy settings can be used to specify the http proxy server to use when sending probe traffic.
router
    http-probe-profile      http-probe-1
        name                http-probe-1
        url                 http://172.16.2.5:5060/
        valid-status-code   202
        valid-status-code   200
        probe-duration      6
        probe-interval      10
        number-of-attemps   3
        proxy-settings
            proxy-address   192.168.1.48
            proxy-port      8080
        exit
    exit
exit
| Name | Constraints | Type | Description |
|---|---|---|---|
| proxy-address | key | ipv4-address | Proxy server IP address. |
| proxy-port | optional | uint32 | Proxy server port. If an address is given, this port will default to port 80. |
HTTP Probe Log Level
- Config Path: authority > router[name] > http-probe
- Config Fields:
| Name | Type | Constraints | Description |
|---|---|---|---|
| log-level | enum | default: info | Http Probe Log Level |
- Example:
config

    authority

        router  my-router
            http-probe
                log-level debug
            exit
        exit
    exit
exit
Service Route Configuration
Once the profile is created, the next step is to enable the reachability enforcement and probe detection for a non SVR service-route and reference the profile in that config.
-
Config Path: authority > router[name] > service-route[name] > reachability-detection
-
Config Fields: The following fields should be enabled for the probe based detection to work. The http-probe mechanism is based on the concept of health probes described here. The configuration fields below are required for the system to react to the loadbalancer API calls that the plugin makes.
| Name | Type | Value | Description |
|---|---|---|---|
| enforcement | boolean | true | Toggle the configuration to be enabled for the reachability enforcement to take effect. |
| probe-type | enumeration | always | For probe based reachability detection to take effect the probe-type must be set to always. |
| probe > probe-type | enumeration | http-probe | The probe-type must be set to http-probe in order to leverage the HTTP(s) based probing |
| probe > http-probe-profile | reference | - | Reference to a previously configured http-probe-profile on the router |
The reachability-detection > probe configuration allows for multiple probes of various types to be configured. All the probes for a given service-route must be up for the route to be considered as up.
Probe reachability
The router should have a distinct path for the probe traffic. It is recommended that the user create dedicated services and service routes for this purpose. At this time, the plugin does not generate any configuration to ensure the reachability of the probe traffic to the destination. The probe will be originated in the default linux environment. In case of in-band management, the probe traffic will be associated with the _internal_ tenant so care must be taken to allow the tenant when creating such config. As a reference the following configuration represents a service and route to reach one of the HTTP probes in this document.
config

    authority

        service  http-probe-1
            name                  http-probe-1

            transport             tcp
                protocol    tcp

                port-range  5060
                    start-port  5060
                exit
            exit
            address               172.16.2.5

            access-policy         _internal_
                source  _internal_
                permission allow
            exit
            share-service-routes  false
        exit

        router  my-router
            name           my-router

            service-route  http-probe-rte-1
                name          http-probe-rte-1
                service-name  http-probe-1

                next-hop      node1 wan
                    node-name  node1
                    interface  wan
                exit
            exit
        exit

    exit
exit
Up Delay Timer
Version History
| Release | Modification |
|---|---|
| 2.1.0 | http-probe-profile > up-delay-timer introduced |
An up-delay-timer can be configured on a probe to prevent a probe watching an unstable service path from coming up right away. When a probe state transitions from down to up, instead of bringing that probe up, if an up-delay-timer is configured the probe will be kept down until the timer finishes. If the probe goes back down while the timer is running, the timer will cancel and the probe will remain down. If it is set to the default value (0) then the timer is disabled.
It is recommended that a probe's up-delay-timer has a value greater than the probe-interval field. This configuration allows the probe to run at least one more time while the timer is active. A warning will be produced if a probe is configured with an up-delay-timer value less than the probe-interval. If a configuration reload occurs while a probe timer is active, the timer is honored with the previous config.
The below example shows a probe with a configured up-delay-timer; with these settings, the test will be triggered every 10 seconds, 3 probes with a single probe timeout of 2 seconds will be applied and when the probe transitions from down > up it will be held down for 15 seconds.
router
    http-probe-profile      http-probe-1
        name                http-probe-1
        url                 http://172.16.2.5:5060/
        valid-status-code   202
        valid-status-code   200
        probe-duration      6
        probe-interval      10
        number-of-attemps   3
        up-delay-timer      15
    exit
exit
Use Cases
Path selection
One of the primary use cases of the plugin would be to monitor the internet or some other service reachability by pinging an HTTP server over a given service path. This is very much similar in concept to the native ICMP probe functionality that exists in the product.
Proportional Load balancing via destination NATs
In this use case, a particular service or workflow is designed to be load balanced across several upstream servers by doing a proportional load balancing along with destination NAT. In this use case, the SSR http-probe plugin can be used to monitor the service status of each of those upstream servers to determine if the particular server should be in service or not from routing perspective. The following configuration snippet builds on the example above to demonstrate this scenario.
In this example, both test-app-route-1 and test-app-route-2 are equal cost routes used for proportional load balancing.
config

    authority

        router  my-router
            name           my-router

            service-route  test-app-route-1
                name                    test-app-route-1
                service-name            test-app
                vector                  path1
                nat-target              172.16.2.5

                next-hop                node1 wan-bb
                    node-name  node1
                    interface  wan-bb
                exit

                reachability-detection
                    enabled               true
                    enforcement           true
                    reachability-profile  dummy
                    probe-type            always

                    probe                 probe1
                        name                probe1
                        http-probe-profile  http-probe-1
                    exit
                exit
            exit

            service-route  test-app-route-2
                name                    test-app-route-2
                service-name            test-app
                vector                  path2
                nat-target              172.16.3.5

                next-hop                node1 wan-lte
                    node-name  node1
                    interface  wan-lte
                exit

                reachability-detection
                    enabled               true
                    enforcement           true
                    reachability-profile  dummy
                    probe-type            always

                    probe                 probe2
                        name                probe2
                        http-probe-profile  http-probe-2
                    exit
                exit
            exit
        exit
    exit
exit

admin@node1.conductor1#
Each service-route is designed to probe a unique URL for that server and monitor the health of the service at the TCP socket level as well as the HTTP stack. When one of the servers either cannot be reached, responds with an unsuccessful status code (e.g. 404, 504 etc), or the configured SLA is not met, the service path is taken out of service.
When all the service routes associated with the same service are down, the default system behavior is to operates in a best-effort mode in which the physical link and L2 connectivity is used to determine the health of the path. In this case, it is possible that sessions are routed to paths that are down from a probe perspective. As soon as one of the paths comes back in service, the load balancer will start using that path for all subsequent new sessions. The best-effort flag can be set to false for the associated service-policy to disable this behavior.
Troubleshooting
Checking the probe status
The show service-path command can be used to view the current status of the probe and to view how the load balancer is interpreting the current status. For example:
admin@node1.conductor1# show service-path router my-router node node1 service-name test-app
Sun 2021-11-07 03:19:33 UTC
Node: node1.my-router Page 1

========== ================== =============== =============== ============ =========== ======== ====== ====== ========== ==========
 Service    Service-Route      Type            Destination     Next-Hop     Interface   Vector   Cost   Rate   Capacity   State
========== ================== =============== =============== ============ =========== ======== ====== ====== ========== ==========
 test-app   test-app-route-1   service-agent   172.16.2.5/32   172.16.2.5   wan-bb      path1     100      0   0/100      Up(Up)
 test-app   test-app-route-2   service-agent   172.16.3.5/32   172.16.3.5   wan-lte     path2     100      0   0/100      Up(Down)

Completed in 0.05 seconds
admin@node1.conductor1#admin@node1.conductor1#
The show plugins state router <router-name> summary 128T-http-probe command can be used to view the current status of the probe and whether the probe is being held down. For example:
admin@node1.conductor1# show plugins state router my-router summary 128T-http-probe
Wed 2024-10-02 03:19:33 UTC
Target: node1.my-router

============= ======== =========== =================
 Probe         Status   Held Down   Time Left (sec)
============= ======== =========== =================
 test-probe1   up       True                      8
 test-probe2   down     False                     0

Retrieved state data.
Completed in 0.05 seconds
In addition, the probe's running status in linux can be found by inspecting the 128T-http-probe-status-change-notifier@<probe-name>.service. For example,
# systemctl status 128T-http-probe-status-change-notifier@http-probe-2.service -l
● 128T-http-probe-status-change-notifier@http-probe-2.service - HTTP Monitor Status change observer for destination http-probe-2
   Loaded: loaded (/usr/lib/systemd/system/128T-http-probe-status-change-notifier@.service; static; vendor preset: disabled)
   Active: inactive (dead) since Sun 2021-11-07 03:22:43 UTC; 8s ago
  Process: 24823 ExecStart=/usr/libexec/128T-http-probe/scripts/loadbalancer_cli --probe-name ${NAME} determine-status --status ${STATUS} --code ${CODE} (code=exited, status=0/SUCCESS)
 Main PID: 24823 (code=exited, status=0/SUCCESS)

Nov 07 03:22:42 my-router.openstacklocal systemd[1]: Starting HTTP Monitor Status change observer for destination http-probe-2...
Nov 07 03:22:43 my-router.openstacklocal loadbalancer_cli[24823]: Determine status for probe http-probe-2 with status down and code 0
Nov 07 03:22:43 my-router.openstacklocal loadbalancer_cli[24823]: Skipping service-route test-app-route-1 with profile {'validStatusCode': [202, 200], 'probeDuration': 5, 'numberOfAttempts': 4, 'probeInterval': 10, 'name': 'http-probe-1', 'url': 'http://172.16.2.5:5060/'}
Nov 07 03:22:43 my-router.openstacklocal loadbalancer_cli[24823]: Processing service-route test-app-route-2 with profile {'validStatusCode': [202, 200], 'probeDuration': 5, 'numberOfAttempts': 4, 'probeInterval': 10, 'name': 'http-probe-2', 'url': 'http://172.16.3.5:5061/'}
Nov 07 03:22:43 my-router.openstacklocal loadbalancer_cli[24823]: http-probe-2: Setting service-path test-app-route-2 for service test-app as down
Nov 07 03:22:43 my-router.openstacklocal systemd[1]: Started HTTP Monitor Status change observer for destination http-probe-2.
Triggering Manual Failover Or Recovery
In some situations, it might be desirable to forcefully trigger a failover or recovery for an otherwise healthy path. In the above example, the primary http-probe-1 can be brought down by doing the following:
- Stop the http-monitor service for the path instance
# systemctl stop http-monitor@http-probe-1.service
- Edit the
/var/run/128technology/plugins/http_monitor/{probe-name}.stateand set theSTATUS=down
# echo "STATUS=down" >> /var/run/128technology/plugins/http_monitor/http-probe-1.state

# systemctl status 128T-http-probe-status-change-notifier@http-probe-1.service -l
● 128T-http-probe-status-change-notifier@http-probe-1.service - HTTP Monitor Status change observer for destination http-probe-1
   Loaded: loaded (/usr/lib/systemd/system/128T-http-probe-status-change-notifier@.service; static; vendor preset: disabled)
   Active: inactive (dead) since Sun 2021-11-07 03:27:34 UTC; 45s ago
  Process: 29533 ExecStart=/usr/libexec/128T-http-probe/scripts/loadbalancer_cli --probe-name ${NAME} determine-status --status ${STATUS} --code ${CODE} (code=exited, status=0/SUCCESS)
 Main PID: 29533 (code=exited, status=0/SUCCESS)

Nov 07 03:27:34 my-router.openstacklocal systemd[1]: Starting HTTP Monitor Status change observer for destination http-probe-1...
Nov 07 03:27:34 my-router.openstacklocal loadbalancer_cli[29533]: Determine status for probe http-probe-1 with status down and code 200
Nov 07 03:27:34 my-router.openstacklocal loadbalancer_cli[29533]: Processing service-route test-app-route-1 with profile {'validStatusCode': [202, 200], 'probeDuration': 5, 'numberOfAttempts': 4, 'probeInterval': 10, 'name': 'http-probe-1', 'url': 'http://172.16.2.5:5060/'}
Nov 07 03:27:34 my-router.openstacklocal loadbalancer_cli[29533]: http-probe-1: Setting service-path test-app-route-1 for service test-app as down
Nov 07 03:27:34 my-router.openstacklocal loadbalancer_cli[29533]: Skipping service-route test-app-route-2 with profile {'validStatusCode': [202, 200], 'probeDuration': 5, 'numberOfAttempts': 4, 'probeInterval': 10, 'name': 'http-probe-2', 'url': 'http://172.16.3.5:5061/'}
Nov 07 03:27:34 my-router.openstacklocal systemd[1]: Started HTTP Monitor Status change observer for destination http-probe-1.
The same steps can be used to bring up a path that is currently down by changing STATUS=up in the steps above.
Metrics
In-memory metrics were added for http probe SLA values
# show stats http-probe
Wed 2024-04-17 02:52:35 UTC
✔ Retrieving statistics...

Http Probe Stats Metrics
------------------------

===================== ======= ==================== ====================
 Metric                Node    Probe-profile-name                Value
===================== ======= ==================== ====================
 average-rtt           test2   http-probe-1                       0.12
 dns-resolution-time   test2   http-probe-1         2.1130787988658994
 jitter                test2   http-probe-1                       0.02
 loss                  test2   http-probe-1                          0
 max-rtt               test2   http-probe-1                       0.13
 min-rtt               test2   http-probe-1                       0.11
 updated               test2   http-probe-1         1718376794.8707266


Completed in 0.21 seconds
Release Notes
Release 3.0.0
New Features and Improvements
Support for install and upgrade of a customized upstream Linux-based SSR OS distribution for 7.0 and above.
On conductor, the plugin will auto upgrade to this version when upgrading from 6.x to 7.x version of SSR software. In addition, all routers will also be auto upgraded to their respective Oracle Linux 7 or Oracle Linux 9 plugin version depending on the SSR version running on the device.
Release Date: Oct 13, 2025
Release 2.3.1
Release Date: Jun 18, 2025
Issues Fixed
- PLUGIN-3017 Resolve issue where SLA was not respected due to a mismatch in time magnitude comparisons (seconds vs milliseconds).
Release 2.3.0
Release Date: Apr 30, 2025
New Features and Improvements
- PLUGIN-2505 HTTP Probe Proxy Support
Issues Fixed
- PLUGIN-2959 Resolve copying unnecessary files on image-based upgrade
Release 2.2.0
Release Date: Jan 8, 2025
New Features and Improvements
- PLUGIN-2505 Ensure server is restarted on upgrade
- PLUGIN-2505 Improved debuggability of probe and up-delay-timer
Release 2.1.0
Release Date: Oct 31, 2024
New Features and Improvements
- PLUGIN-2510 Implement an up-delay-timer
The plugin allows users to configure an up-delay-timer which holds a path down for a set duration before bringing the path up.
Issues Fixed
- PLUGIN-2629 Display stats in older (5.X) SSR releases
- PLUGIN-2721 Resolve on plugin downgrade config removal
Release 2.0.0
Image based install and upgrade (IBU) support for SSR 6.3.0.
Release Date: Sep 30, 2024
Release 1.2.0
Release Date: Aug 20, 2024
New Features and Improvements
- PLUGIN-2300 Implement SLA monitoring per probe
The plugin allows users to configure the following SLA settings: max-loss, max-jitter, average-rtt. These settings are considered as part of the probe success criteria. Additionally, these values are available through metrics.
Release 1.0.2
Release Date: Apr 29, 2022
Issues Fixed
-
PLUGIN-1680 The HTTP probe status takes a very long time to detect upstream failure
Resolution: The logic for detecting upstream failures for combination of very small duration and retry has been improved upon.
Release 1.0.1
Issues Fixed
-
PLUGIN-1640 Error downloading router components when http-probe plugin enabled on a router
Resolution: Updated the salt states to provide the correct router components.