Inline Flow Performance Monitoring
Inline Flow Performance Monitoring (FPM) complements BFD in measuring peer paths between two SSR devices. To provide this additional level of detail, the initiating router adds a small amount of metadata to a sample number of packets. This metadata indicates that metrics are collected per path, traffic class, and protocol (TCP or UDP). The receiving router reads the metadata and returns the data to the initiating router. The configurable fields include:
name: The name of the performance monitoring profile.marking-count: The number of packets to mark within a given interval.interval-duration: The duration of a packet marking interval in milliseconds.monitor-only: Default isfalse. This generates metrics and provides those metrics for calculating SLA and making load balancing decisions. Settingmonitor-onlytotruewill generate metrics, but does not influence load balancing decisions or traffic flow.resource-group: Associate this performance monitoring profile with a top-level resource-group.
Additional information is available at performance-monitoring-profile.
The data returned is organized by traffic class (high/medium/low/best-effort) and protocol (TDP, UDP), giving more granular data on the performance of a link - not just through synthetic traffic (BFD), but by piggybacking onto actual user traffic.
A bit about traffic-class
The SSR has four traffic classes, in order of priority: high, medium, low, best-effort. The traffic-class allows you to configure different treatments for different classes of traffic for the same service.
Working in concert with the traffic engineering subsystem, this lets you determine which paths the traffic referenced by a service class will use, and therefore how much guaranteed bandwidth is reserved for each class.
Configuration
From the Command Line:
config

    authority

        performance-monitoring-profile  wan-assurance-monitoring-profile
            name               wan-assurance-monitoring-profile
            marking-count      100
            interval-duration  10000
            monitor-only       true
        exit
    exit
exit
From the GUI:
- From the Authority level, scroll down to Performance Monitoring Profiles, and click ADD.
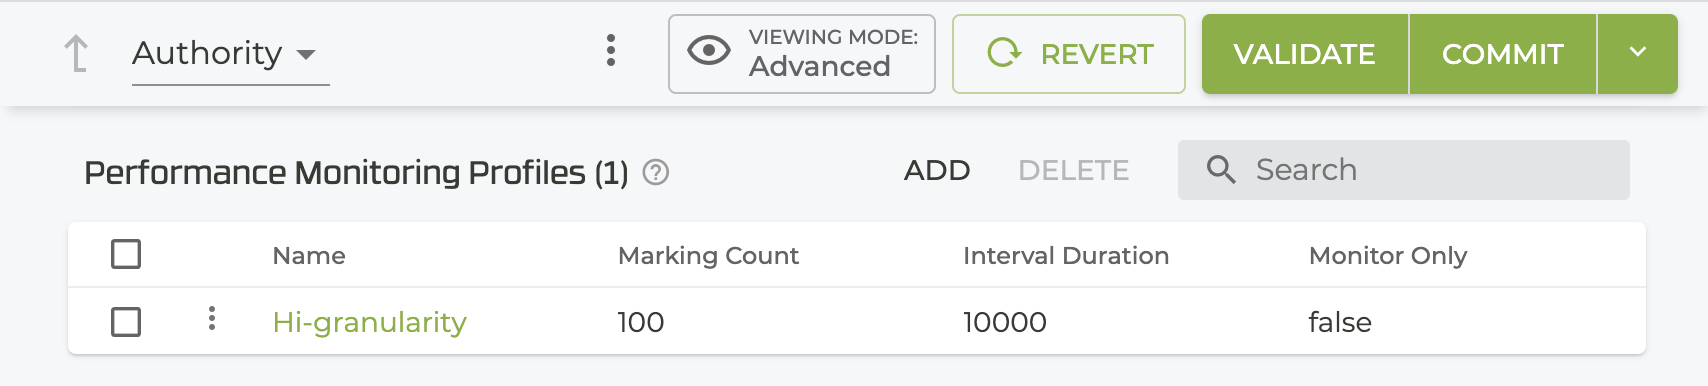
- Enter a name for the profile.

- Configure monitoring values, or accept the defaults to gather a baseline.
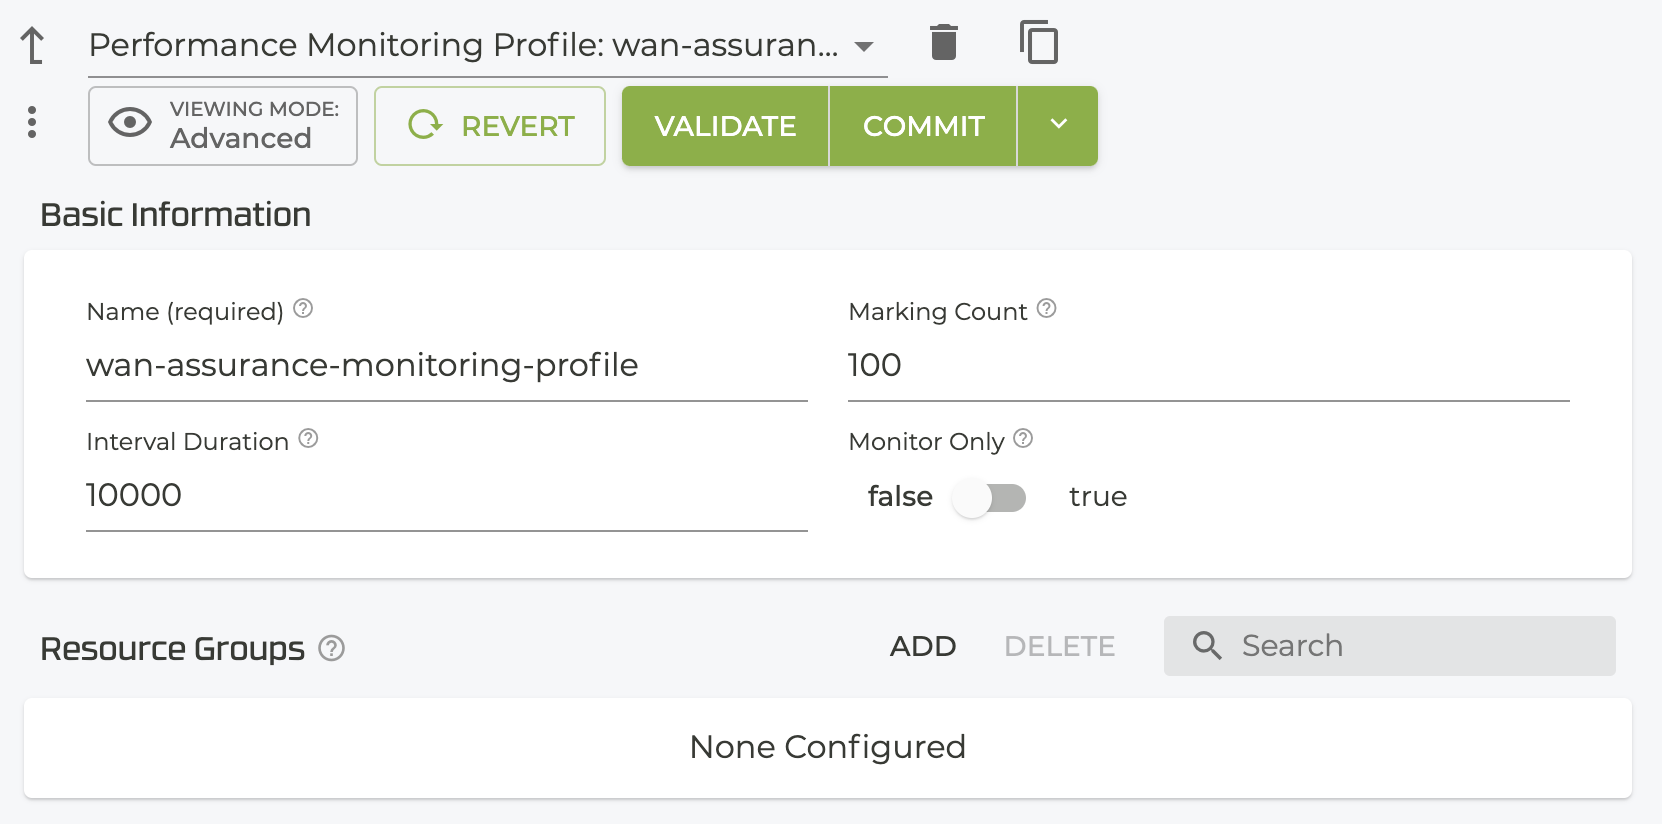
The default setting for Monitor Only is false. This generates metrics and provides those metrics for calculating SLA and making load balancing decisions. Setting monitor-only to true will generate metrics, but does not influence load balancing decisions or traffic flow.
-
Optionally, assign the profile to a Resource Group.
-
Validate and Commit the configuration changes.
Additionally, ensure that the profile is applied to your peer paths. This is generally configured through router > node > device-interface > network-interface > neighborhood. Apply the profile to both sides of the SVR peer path.
Load Balancing
Flow Performance Monitoring (FPM) operates on top of existing traffic, and does not initiate its own traffic. Because of the interval timing and sample time, no significant load is added to the path. In monitor-mode true, no impact to load balancing is generated.
When monitor-mode is set to true, the FPM metrics are collected, but are not reported to the load balancer.
With monitor-mode set to false, both BFD and FPM provide metrics for calculating SLA and making load balancing decisions. By default, the metrics generated by FPM are used in favor of BFD metrics, and will influence load balancing.
To collect accurate metrics, FPM requires that user traffic be actively traversing the path. When FPM derived SLA metrics indicate that a path is no longer suitable, the load balancer may steer all user traffic away from that path, depending on how session-resiliency is configured. If SLA steers ALL sessions away from a specific path (except BFD traffic), then FPM will not generate any new metrics. The FPM metrics become stale and the load balancer then harvests performance metrics from BFD. Once the metrics from BFD indicate that the path is better, it (if session-resiliency is configured as revertible-failover) reverts all sessions back, in addition to allowing new sessions to be created using that path. Once traffic is again flowing, FPM path metrics are collected and used with the load balancer.
Show Commands
Use show stats performance-monitoring to view the results. The following metrics are provided:
peer-path jitter: Jitter in milliseconds for the SSR peer path.peer-path latency: Latency in milliseconds for the SSR peer path.peer-path loss: Packet loss percentage for the SSR peer path.peer-path mos: MOS value calculated for the SSR peer path (hundredths of a decimal).peer-path updated: Time of last reported FPM activity on this peer path.
admin@labsystem1.fiedler# show stats performance-monitoring router all force
Tue 2021-11-09 11:19:51 EST
✔ Retrieving statistics...

Highway Manager Performance Monitoring Stats
--------------------------------------------

=================== =========== ======== =========== ================ ============= ====== =============== ========== ============
 Metric              Router      Node     Peer-name   Peer-host        Device-name   Vlan   Traffic-class   Protocol        Value
=================== =========== ======== =========== ================ ============= ====== =============== ========== ============
 peer-path jitter    natick      flutie   greyhaven   10.65.228.68     enp1s0f3         0   low             udp                21
                                 flutie   greyhaven   10.65.228.68     enp1s0f3         0   medium          udp                12
                                 flutie   greyhaven   192.168.2.101    enp1s0f3         0   low             udp                 4
                                 flutie   greyhaven   192.168.2.101    enp1s0f3         0   medium          udp                51
                                 flutie   westfield   10.0.0.41        enp1s0f3         0   medium          udp                 0
                     westfield   monty    natick      108.20.166.32    enp1s0           0   medium          udp                 1
                                 monty    natick      108.49.110.151   enp1s0           0   medium          udp                 0
 peer-path latency   natick      flutie   greyhaven   10.65.228.68     enp1s0f3         0   low             udp                78
                                 flutie   greyhaven   10.65.228.68     enp1s0f3         0   medium          udp                64
                                 flutie   greyhaven   192.168.2.101    enp1s0f3         0   low             udp                45
                                 flutie   greyhaven   192.168.2.101    enp1s0f3         0   medium          udp               113
                                 flutie   westfield   10.0.0.41        enp1s0f3         0   medium          udp                18
                     westfield   monty    natick      108.20.166.32    enp1s0           0   medium          udp                15
                                 monty    natick      108.49.110.151   enp1s0           0   medium          udp                 0
 peer-path loss      natick      flutie   greyhaven   10.65.228.68     enp1s0f3         0   low             udp                 0
                                 flutie   greyhaven   10.65.228.68     enp1s0f3         0   medium          udp                 0
                                 flutie   greyhaven   192.168.2.101    enp1s0f3         0   low             udp                 0
                                 flutie   greyhaven   192.168.2.101    enp1s0f3         0   medium          udp                 0
                                 flutie   westfield   10.0.0.41        enp1s0f3         0   medium          udp                 0
                     westfield   monty    natick      108.20.166.32    enp1s0           0   medium          udp                 0
                                 monty    natick      108.49.110.151   enp1s0           0   medium          udp               100
 peer-path mos       natick      flutie   greyhaven   10.65.228.68     enp1s0f3         0   low             udp               434
                                 flutie   greyhaven   10.65.228.68     enp1s0f3         0   medium          udp               436
                                 flutie   greyhaven   192.168.2.101    enp1s0f3         0   low             udp               438
                                 flutie   greyhaven   192.168.2.101    enp1s0f3         0   medium          udp               412
                                 flutie   westfield   10.0.0.41        enp1s0f3         0   medium          udp               440
                     westfield   monty    natick      108.20.166.32    enp1s0           0   medium          udp               440
                                 monty    natick      108.49.110.151   enp1s0           0   medium          udp               100
 peer-path updated   natick      flutie   greyhaven   10.65.228.68     enp1s0f3         0   low             udp        1636474788
                                 flutie   greyhaven   10.65.228.68     enp1s0f3         0   medium          udp        1636216599
                                 flutie   greyhaven   192.168.2.101    enp1s0f3         0   low             udp        1636474188
                                 flutie   greyhaven   192.168.2.101    enp1s0f3         0   medium          udp        1636216603
                                 flutie   westfield   10.0.0.41        enp1s0f3         0   medium          udp        1636466059
                     westfield   monty    natick      108.20.166.32    enp1s0           0   medium          udp        1636466059
                                 monty    natick      108.49.110.151   enp1s0           0   medium          udp        1636025768
Troubleshooting
I am experiencing 100% loss on one node when traffic is flowing:
Verify that the peer router has FPM enabled on its peer path. If not, the peer router will not collect and respond to FPM data analytics queries.
I am seeing infrequent FPM analytics updates when generating test traffic using tools like Iperf:
FPM operates on packets below MTU so calculations are not impacted by fragmentation stacks. Certain test tools that by default generate jumbo traffic may not satisfy this condition. As a result, FPM will not sample packets that will not generate new analytics.
Loss values generated by FPM are very volatile:
Because FPM attaches to existing traffic and does not generate its own, a very short interval duration can lead to inaccurate loss values. This is due to FPM not being able to sample a sufficient number of packets within the given interval. Increasing the interval duration allows more packets to be sampled, providing a more accurate representation of loss on the path.