Application Policy Hit Count
Application Policy Hit Count (APHC) provides insight into the routing policies being used to direct traffic in your network operations; it reports which policies are seeing active traffic ("hit") and how. These values are presented as metrics tracked per service, per tenant; where each tenant service combination could be "hit" in one of the following ways.
| Count | Description |
|---|---|
| Allowed | The session was allowed and created successfully. |
| Failed | The session could not be created. |
| Denied due to Access Policy | The packet was denied because an access policy explicitly disallows access. |
| Denied due to URL Filtering | The session was created but was blocked once app classification was completed. |
| Denied due to Local Service Definition | The session was allowed on another ingress router, but is denied here based on the policy on this router (commonly related to hierarchical services). |
How Does It Work?
Application Policy Hit Count is enabled by default, tracking counts for all observed service and tenant combinations, including the access policy denied counters.
The system maintains the current value in memory and will not provide a historical time series of the data unless configured to do so. To prevent excessive consumption of memory resources, the device periodically removes combinations that are no longer being observed. Inactive tenant service combinations remain in the system for 30 to 60 minutes before being removed.
Configuration
Counter configuration is flexible and can be enabled or disabled on individual routers, or across the whole authority. Counters can be configured to persist the policy hit count metrics, allowing them to be viewed as a time-series graph. The following configuration snippets show how each configure each option.
Disable APHC for the Authority
configure
  authority
    metrics
      application-policy-hit-count-tracking
        enabled false
      exit
    exit
  exit
exit
Disable APHC for the Router
configure
  authority
    router <router>
      system
        metrics
          application-policy-hit-count-tracking disabled
        exit
      exit
    exit
  exit
exit
Disable APHC for the Authority but Enable for a Specific Router
configure
  authority
    metrics
      application-policy-hit-count-tracking
        enabled false
      exit
    exit
    router <router>
      system
        metrics
          application-policy-hit-count-tracking enabled
        exit
      exit
    exit
  exit
exit
Clear Expiring Counts
The cleanup of expired counters runs automatically every 30 minutes. However, in some situations it may be necessary to manually clear hit count entries. In this situation the following command is available:.
clear application-policy-hit-counts [force] [node <node>] {router <router> | resource-group <resource-group>}
This command manually triggers the cleanup process. The execution does not change or prevent the scheduled cleanup run. However, executing the command twice will move cleanup forward by an hour and fully clear the policy hit count metrics.
Persist APHC Metrics
Persistence can be configured using a metrics profile as described in the SSR Documentation. The example below show how to persist all hit count types for a specific service and tenant combination, using the short retention policy. It is a best practice to always use the shortest retention policy that satisfies your requirements.
There are typically a significant number of APHC metrics active on a system. If persistence is necessary, select a small number of service tenant combinations to be persisted. Careless selection may overwhelm the stats infrastructure resulting in resource shortages.
The following configurations are examples only; they should not be directly copied into another environment. Service, tenant, and router names must be replaced.
Authority Configuration
configure
  authority
    metrics-profile internet-policy-hit-counts
      name internet-policy-hit-counts
      metric /stats/application-policy-hit-count/allowed
        id /stats/application-policy-hit-count/allowed
        description "Allowed Hit Count"
      exit
      metric /stats/application-policy-hit-count/failed
        id /stats/application-policy-hit-count/failed
        description "Failed Hit Count"
      exit
      metric /stats/application-policy-hit-count/deny/policy-table
        id /stats/application-policy-hit-count/deny/policy-table
        description "Denied for Explicit Access Policy Hit Count"
      exit
      metric /stats/application-policy-hit-count/deny/local-service
        id /stats/application-policy-hit-count/deny/local-service
        description "Denied After Ingress Router Allowed Hit Count"
      exit
      metric /stats/application-policy-hit-count/deny/url-filtering
        id /stats/application-policy-hit-count/deny/url-filtering
        description "Denied For URL Filtering Hit count"
      exit
      filter service
        parameter service
        value internet
      exit
      filter tenant
        parameter tenant
        value engineering
      exit
    exit
  exit
exit
Router Configuration
configure
  authority
    router <router>
      name <router>
      system
        metrics
          profile internet-policy-hit-counts
            name internet-policy-hit-counts
            retention short
          exit
        exit
      exit
    exit
  exit
exit
Stats Output
The hit count metrics can be accessed via the PCLI as shown. They provide a combination of services and tenants and show how traffic is allowed or blocked. In the example shown, we also see failures due to improperly configured services.
admin@westB.T207_West# show stats application-policy-hit-count node westA
Wed 2025-01-08 18:59:28 UTC
✔ Retrieving statistics...

Highway Manager application policy hit count Stats
--------------------------------------------------

========= ======= ================= ================== =======
 Metric    Node    Tenant            Service            Value
========= ======= ================= ================== =======
 allowed   westA   <global>          lan2-service           1
           westA   red               lan2-service           1
           westA   red               lan2-service         326
 deleted   westA   <global>          lan2-service           1
 failed    westA   <invalidTenant>   <UnknownService>      11
           westA   red               <UnknownService>    5841

Completed in 0.06 seconds
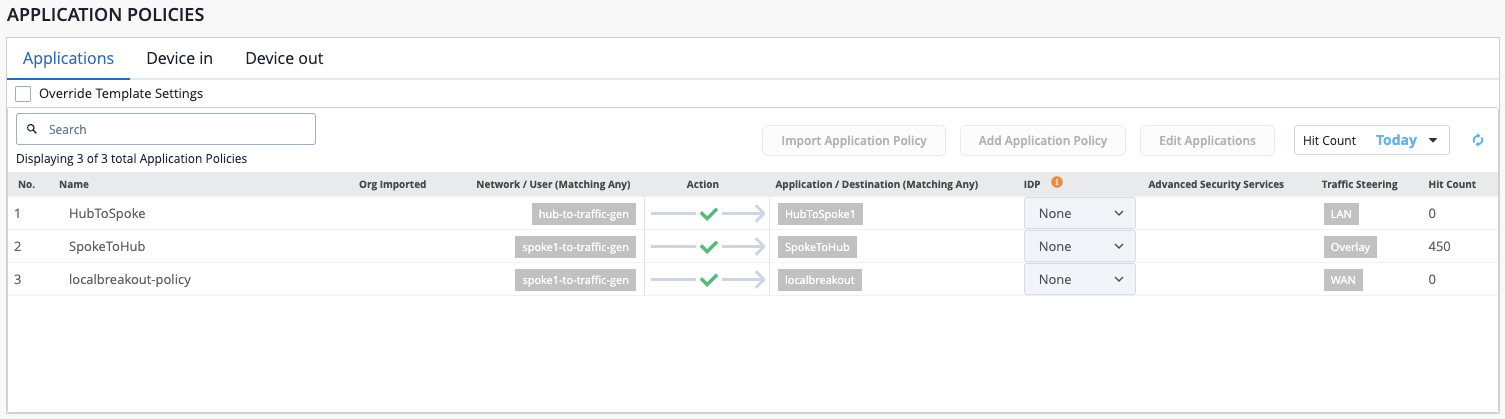
Application Policy Hit Count - Mist Output