SSR Chassis Manager
The SSR400 and SSR440 support an integrated Chassis Manager to help monitor connectivity, power, temperature, as well as providing insight into other vital operational data. This feature is only supported on the SSR400 and SSR440 platforms.
Chassis Manager
Interaction with the Chassis Manager is performed through CLI commands and button presses on the front of the SSR400 and SSR440 chassis. Components include the LED Manager and Temperature Manager.
LED Manager
The LED Manager translates status updates from internal SSR components and provides a high level indicator of System Status via the System LED.
The System LED displays the following colors to report system state:
- Steady Green: Operating normally
- Amber: Device is starting up
- Purple: Operation is degraded
- Red: Error detected in the device
The presence of any major or critical alarms will cause degraded service, resulting in the system LED showing purple. If a Purple or Red LED is seen, use show alarms to view the details of the error or alarm.
Port Status LEDs
Port LEDs have the following behavior to identify port status. The following diagrams identify the port status LEDs for SFP and RJ-45 ports.
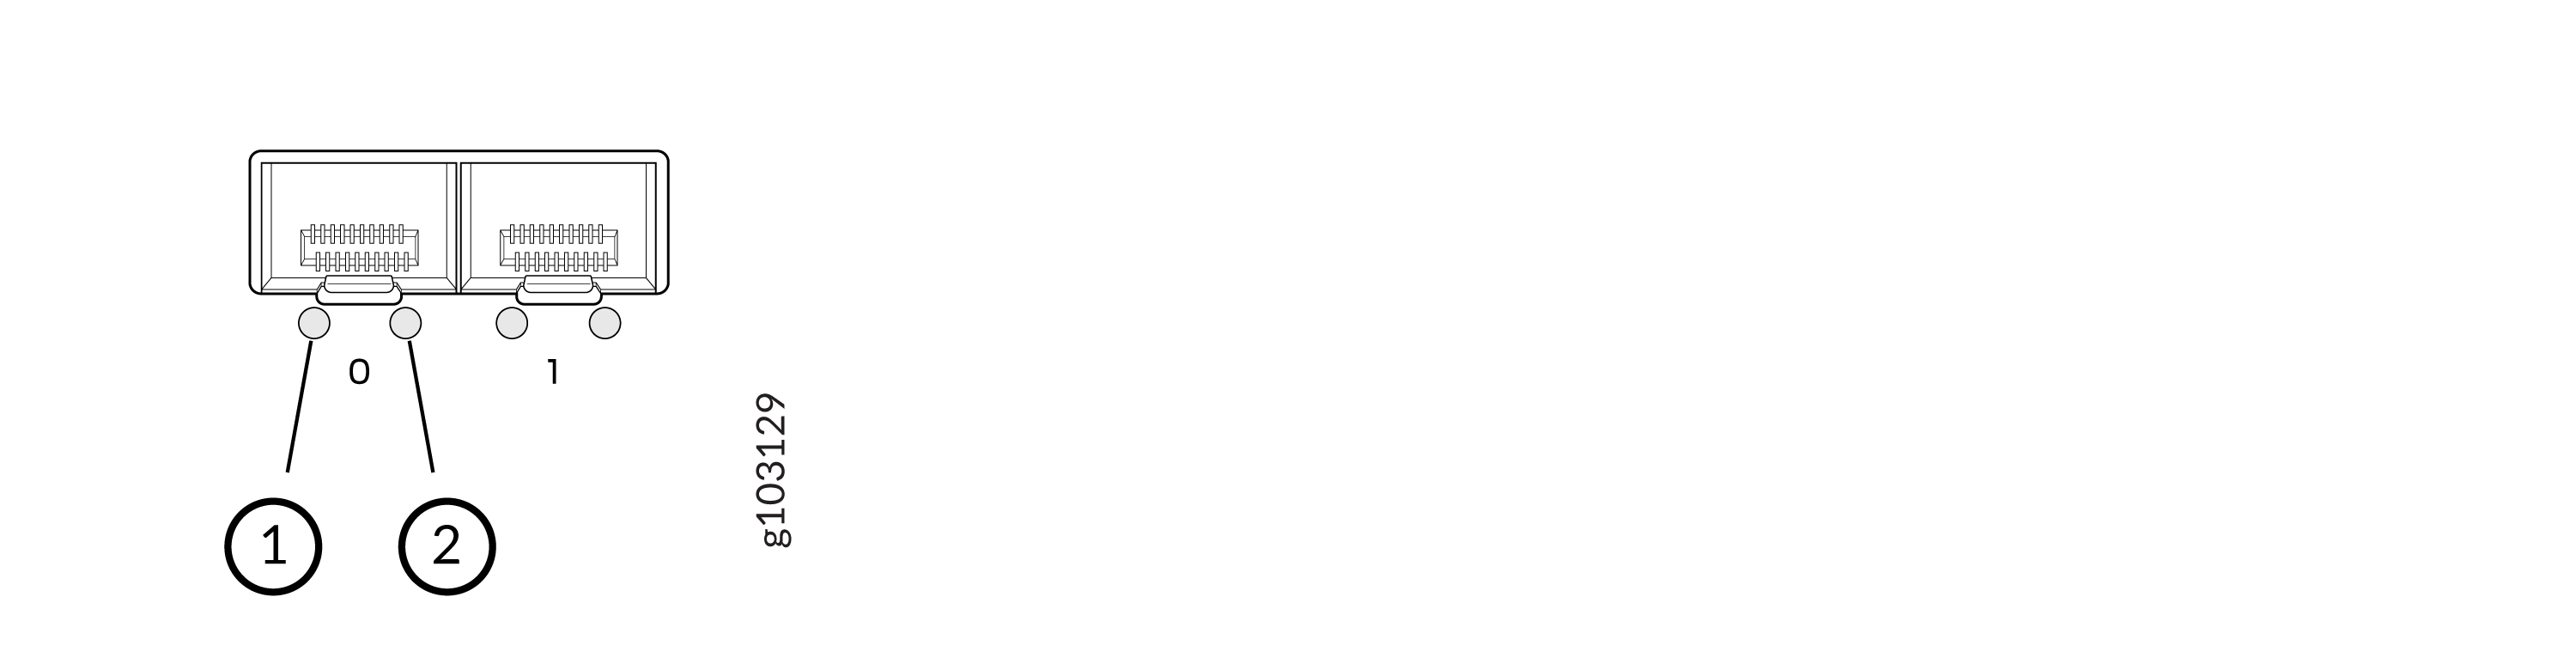
SFP Network Port Status LED Orientation
RJ-45 Network Port Status LED Orientation
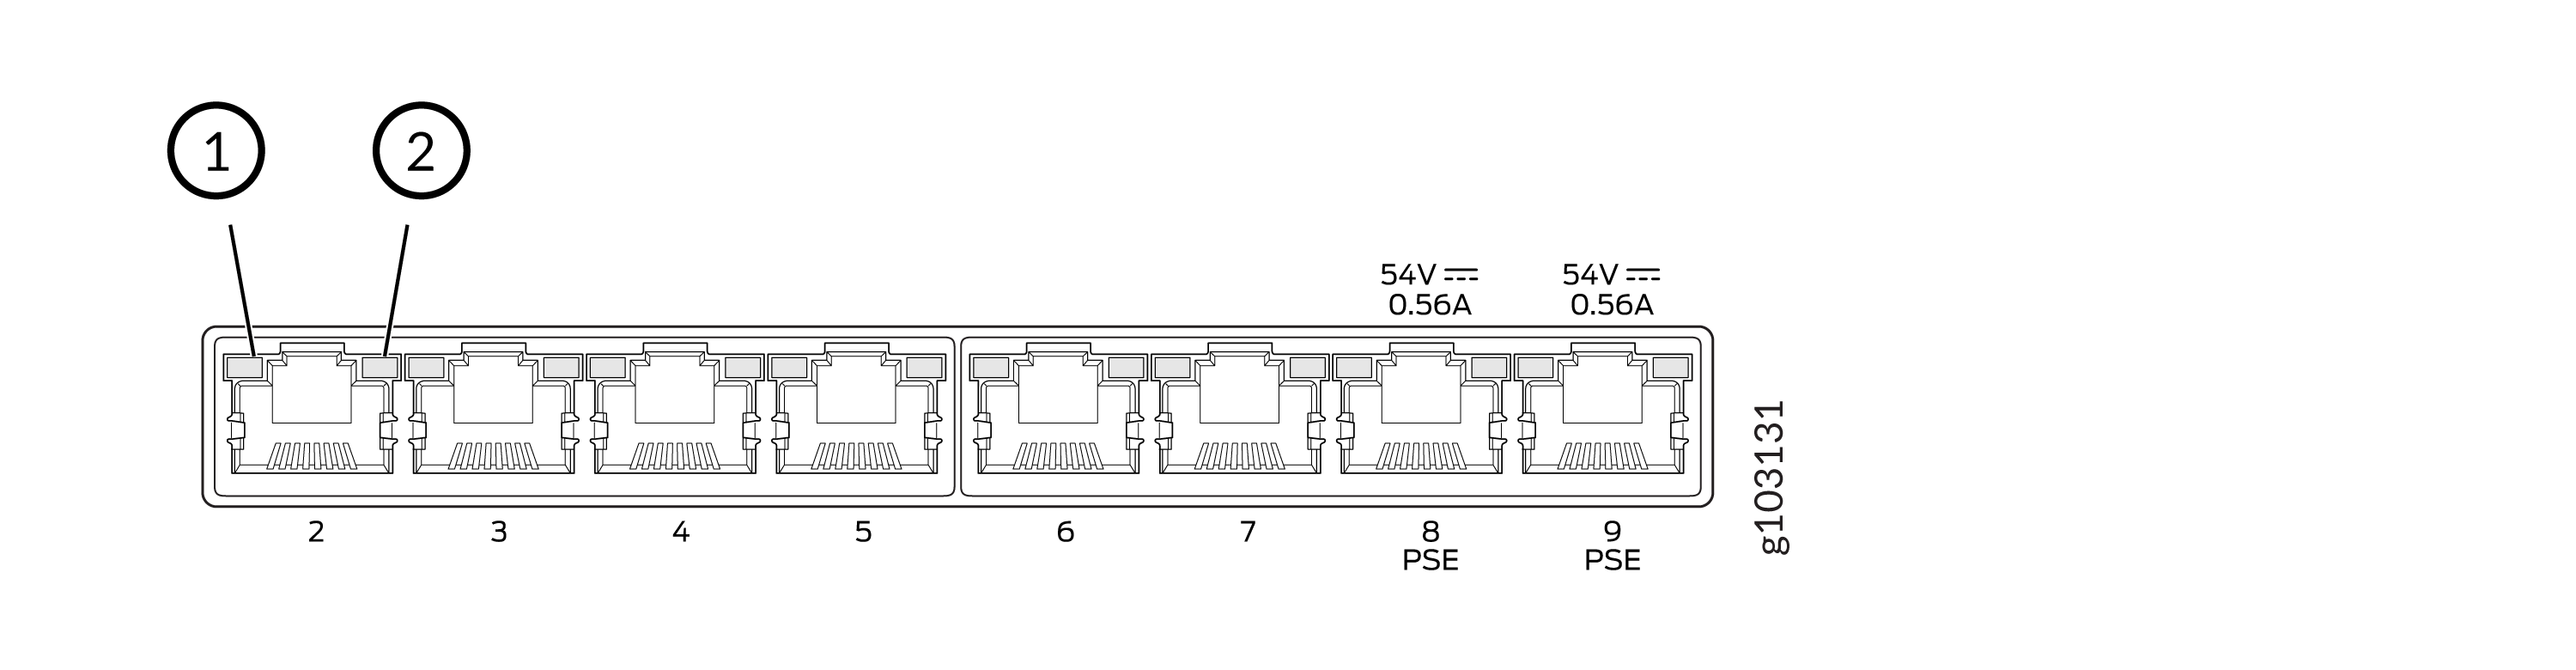
Left LED (1) - Link Activity
- Blinking Green: The port and the link are active, and there is link activity.
- Green On Steadily: The port and the link are active, but there is no link activity.
- Off: The port is not active.
Right LED (2) - Port Speed
Port speed is indicated with the following behavior.
- Unlit: Below 100 Mbps
- Blinking Green: 100 Mbps (1 blink per second)
- Green On Steadily: 1000 Mbps
Temperature Manager
There are three temperature thresholds specified for each sensor:
- Yellow: A MAJOR alarm is generated, warning of high temperatures, but no action is taken.
- Red: A CRITICAL alarm is generated, warning of impending
critical temperature reachedshutdown The CPU is slowed and monitored to reduce heat generation. - Shutdown: When the critical temperature threshold is reached, the system generates a fatal error and immediately shuts down the SSR to prevent any damage to the device.
Use show chassis temperature-thresholds to see the thresholds for each alarm level.
admin@node.router# show chassis temperature-thresholds
Thu 2025-07-17 23:56:07 UTC
Retrieving chassis status...

=========== ============== =========== ==========
 Sensor      Yellow Alarm   Red Alarm   Shutdown
=========== ============== =========== ==========
 cpu         97.0 C         99.0 C      101.0 C
 mac         104.0 C        107.0 C     110.0 C
 mainboard   86.0 C         89.0 C      92.0 C

Completed in 0.01 seconds
CLI Commands
The following show commands allow you to see the chassis status from the CLI.
The following commands are only available on the SSR400 and SSR440 platforms. While they are visible on other platforms, they do not provide data. When executed, they return an error and state they are intended for the SSR400 and SSR440 platforms.
| CLI Command | Function |
|---|---|
show chassis | Display information about the chassis |
show chassis firmware | Show information about the chassis firmware |
show chassis hardware | Show information about the chassis hardware |
show chassis led | Show the status of the chassis LEDs |
show chassis led phy | Show the status of the port LEDs |
show chassis led system | Show the status of the System LED |
show chassis power | Show chassis power |
show chassis temperature | Show chassis temperature sensor readings |
show chassis temperature-thresholds | Show chassis temperature thresholds |
DC Power LEDs
The DC Power LEDs are not managed by the Chassis Manager, but the LEDs are used to indicate status.
- Steady Green: Receiving power
- Off: Power failure or no power
HA Port Status LEDs
The HA Port Status LEDs are located on the HA ports on the rear of the device, and are not managed by the Chassis Manager. However, the LEDs are used to indicate the Link Activity and Speed.
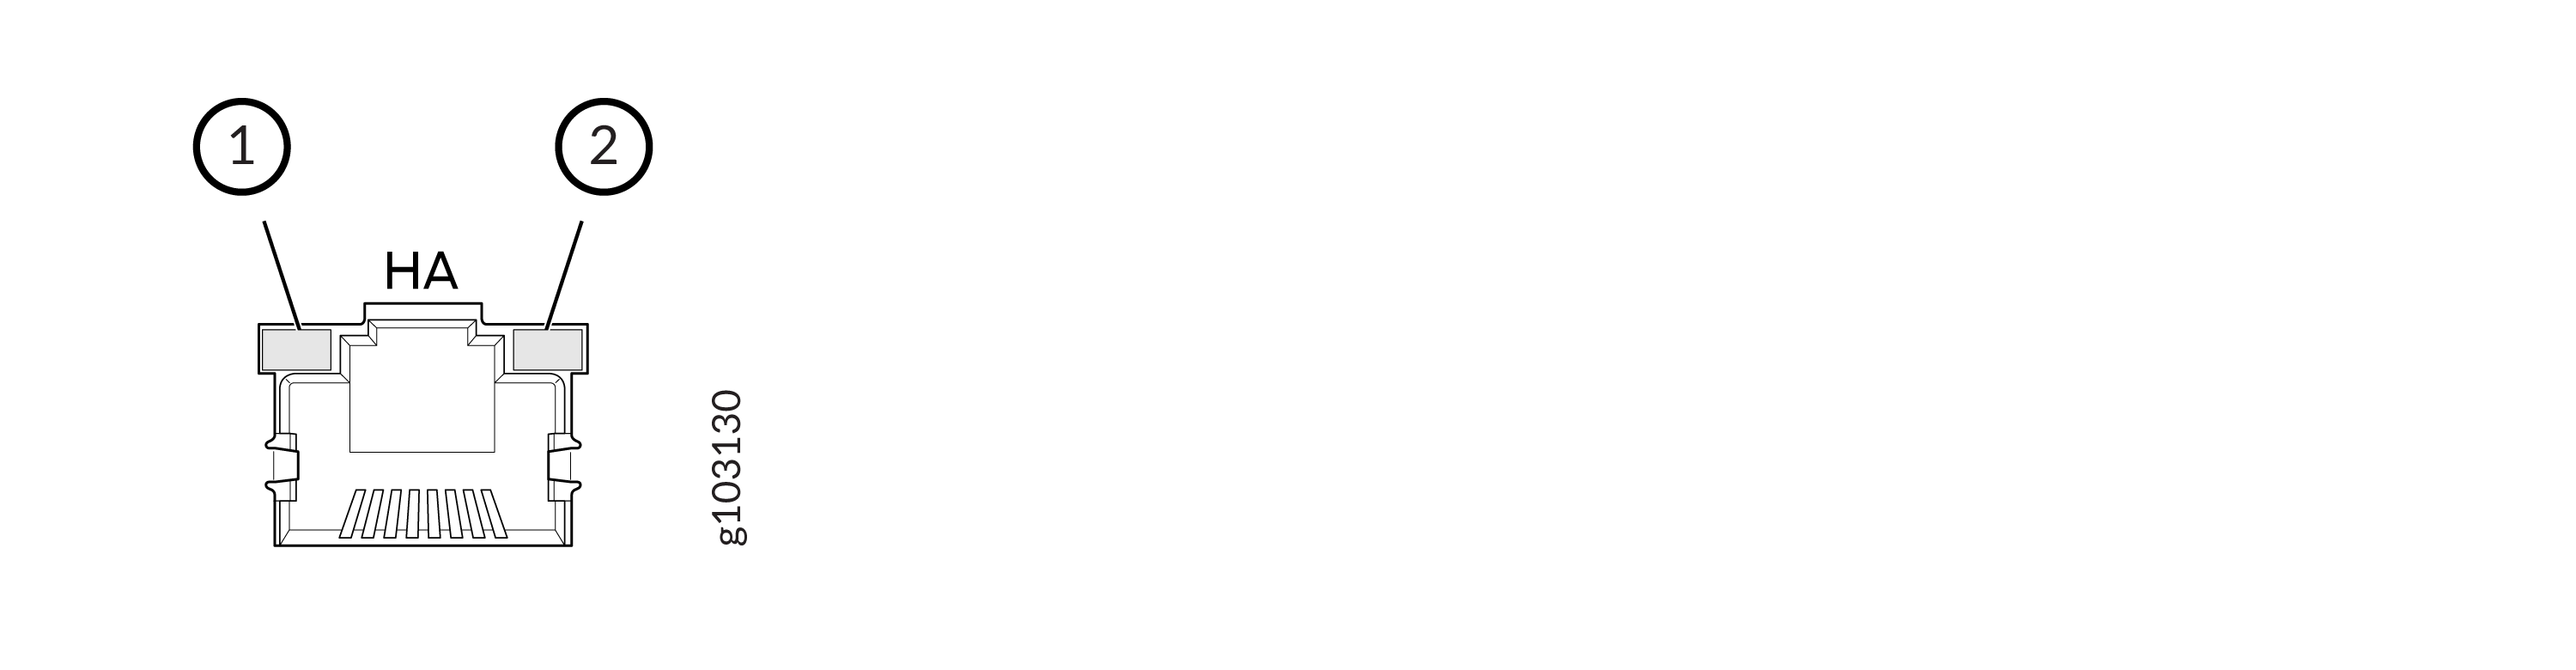
Left LED (1) - Port Activity
Port activity is indicated with the following behavior:
-
Blinking Green: The port and the link are active, and there is link activity.
-
Steady Green: The port and the link are active, but there is no link activity.
-
Off: The port is not active.
Right LED (2) - Port Speed
Port speed is indicated with the following behavior.
-
Blinking Green: 1000 Mbps (1 blink per second)
-
Steady Green: 100 Mbps
-
Unlit: 10 Mbps