CPU Spikes
This guide is to be used when investigating the root cause for an SSR that reports alarms of CPU spikes.
Expected Behavior
A CPU alarm is triggered when the average CPU of all of the cores on a system exceeds 85% for thirty seconds. This will not include any CPU cores that are pinned for packet forwarding. The alarm is cleared when the average CPU is below 85% for five (5) seconds.
You can determine whether a system has pinned CPU cores by checking the configuration. The CPU allocation is defined within the node configuration of a router.
admin@gouda.novigrad# show config running authority router novigrad node gouda

config

    authority

        router  novigrad
            name  novigrad

            node  gouda
                name                        gouda
                enabled                     true
                forwarding-core-mode        automatic
In particular, the forwarding-core-count indicates how many cores are dedicated for fast packet forwarding.
The default configuration has forwarding-core-mode set to automatic with no forwarding-core-count defined. The SSR platform will attempt to right-size the configuration based on system's available resources. For some deployments, it may be desirable to override the defaults to optimize the platform for your environment.
When the forwarding-count-mode is set to automatic, you can see how the system has allocated resources by issuing the command show platform cpu.
admin@gouda.novigrad# show platform cpu
Thu 2020-03-19 15:23:24 UTC

===================================================================
 gouda
===================================================================
 ---------------
 CPU Information
 ---------------
 Type:                     Intel(R) Atom(TM) CPU  C2558  @ 2.40GHz
 Speed:                    2.400096893310547 GHz
 Hyper-Threading:          no
 Cores:                    4
 Forwarding Cores:         1
 Isolated Cores:           1
 Power-Saver:              disabled

Completed in 2.75 seconds
With an understanding of how the system is configured, we can now get to the process of examining the history of CPU usage over time. The SSR stores time series data for a number of KPIs that are relevant for system and service health and operation. Viewing time series data is best accomplished within the GUI.
Navigate to the Custom Reports located on the dashboard. From there create two reports: one for total utilization per CPU and another for utilization per SSR process, as indicated by the images below.
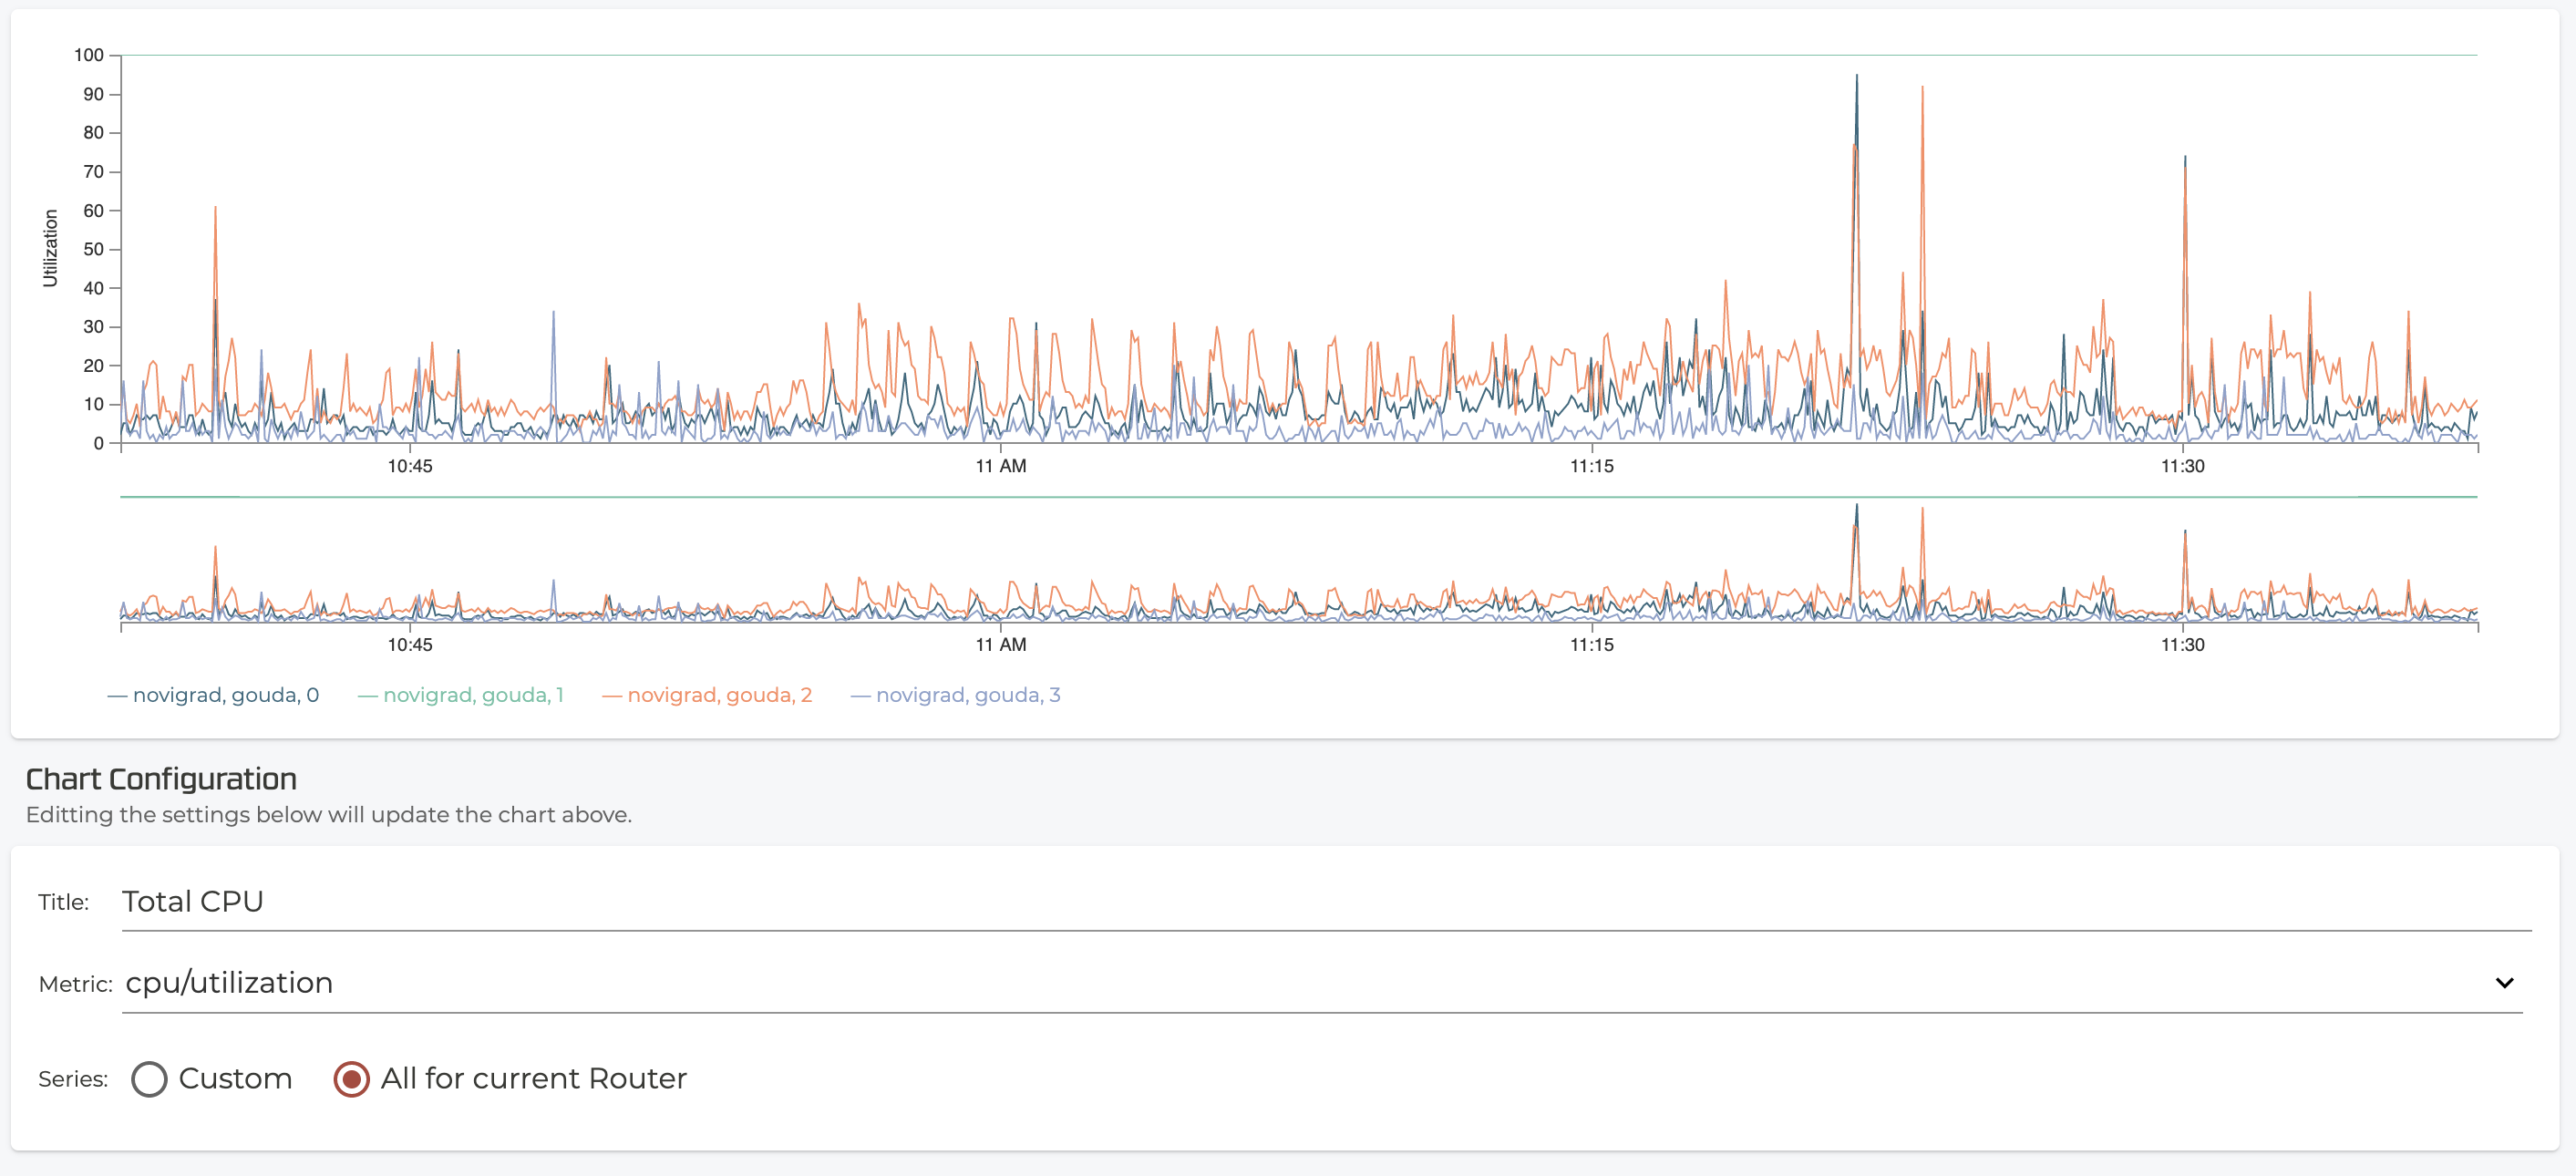
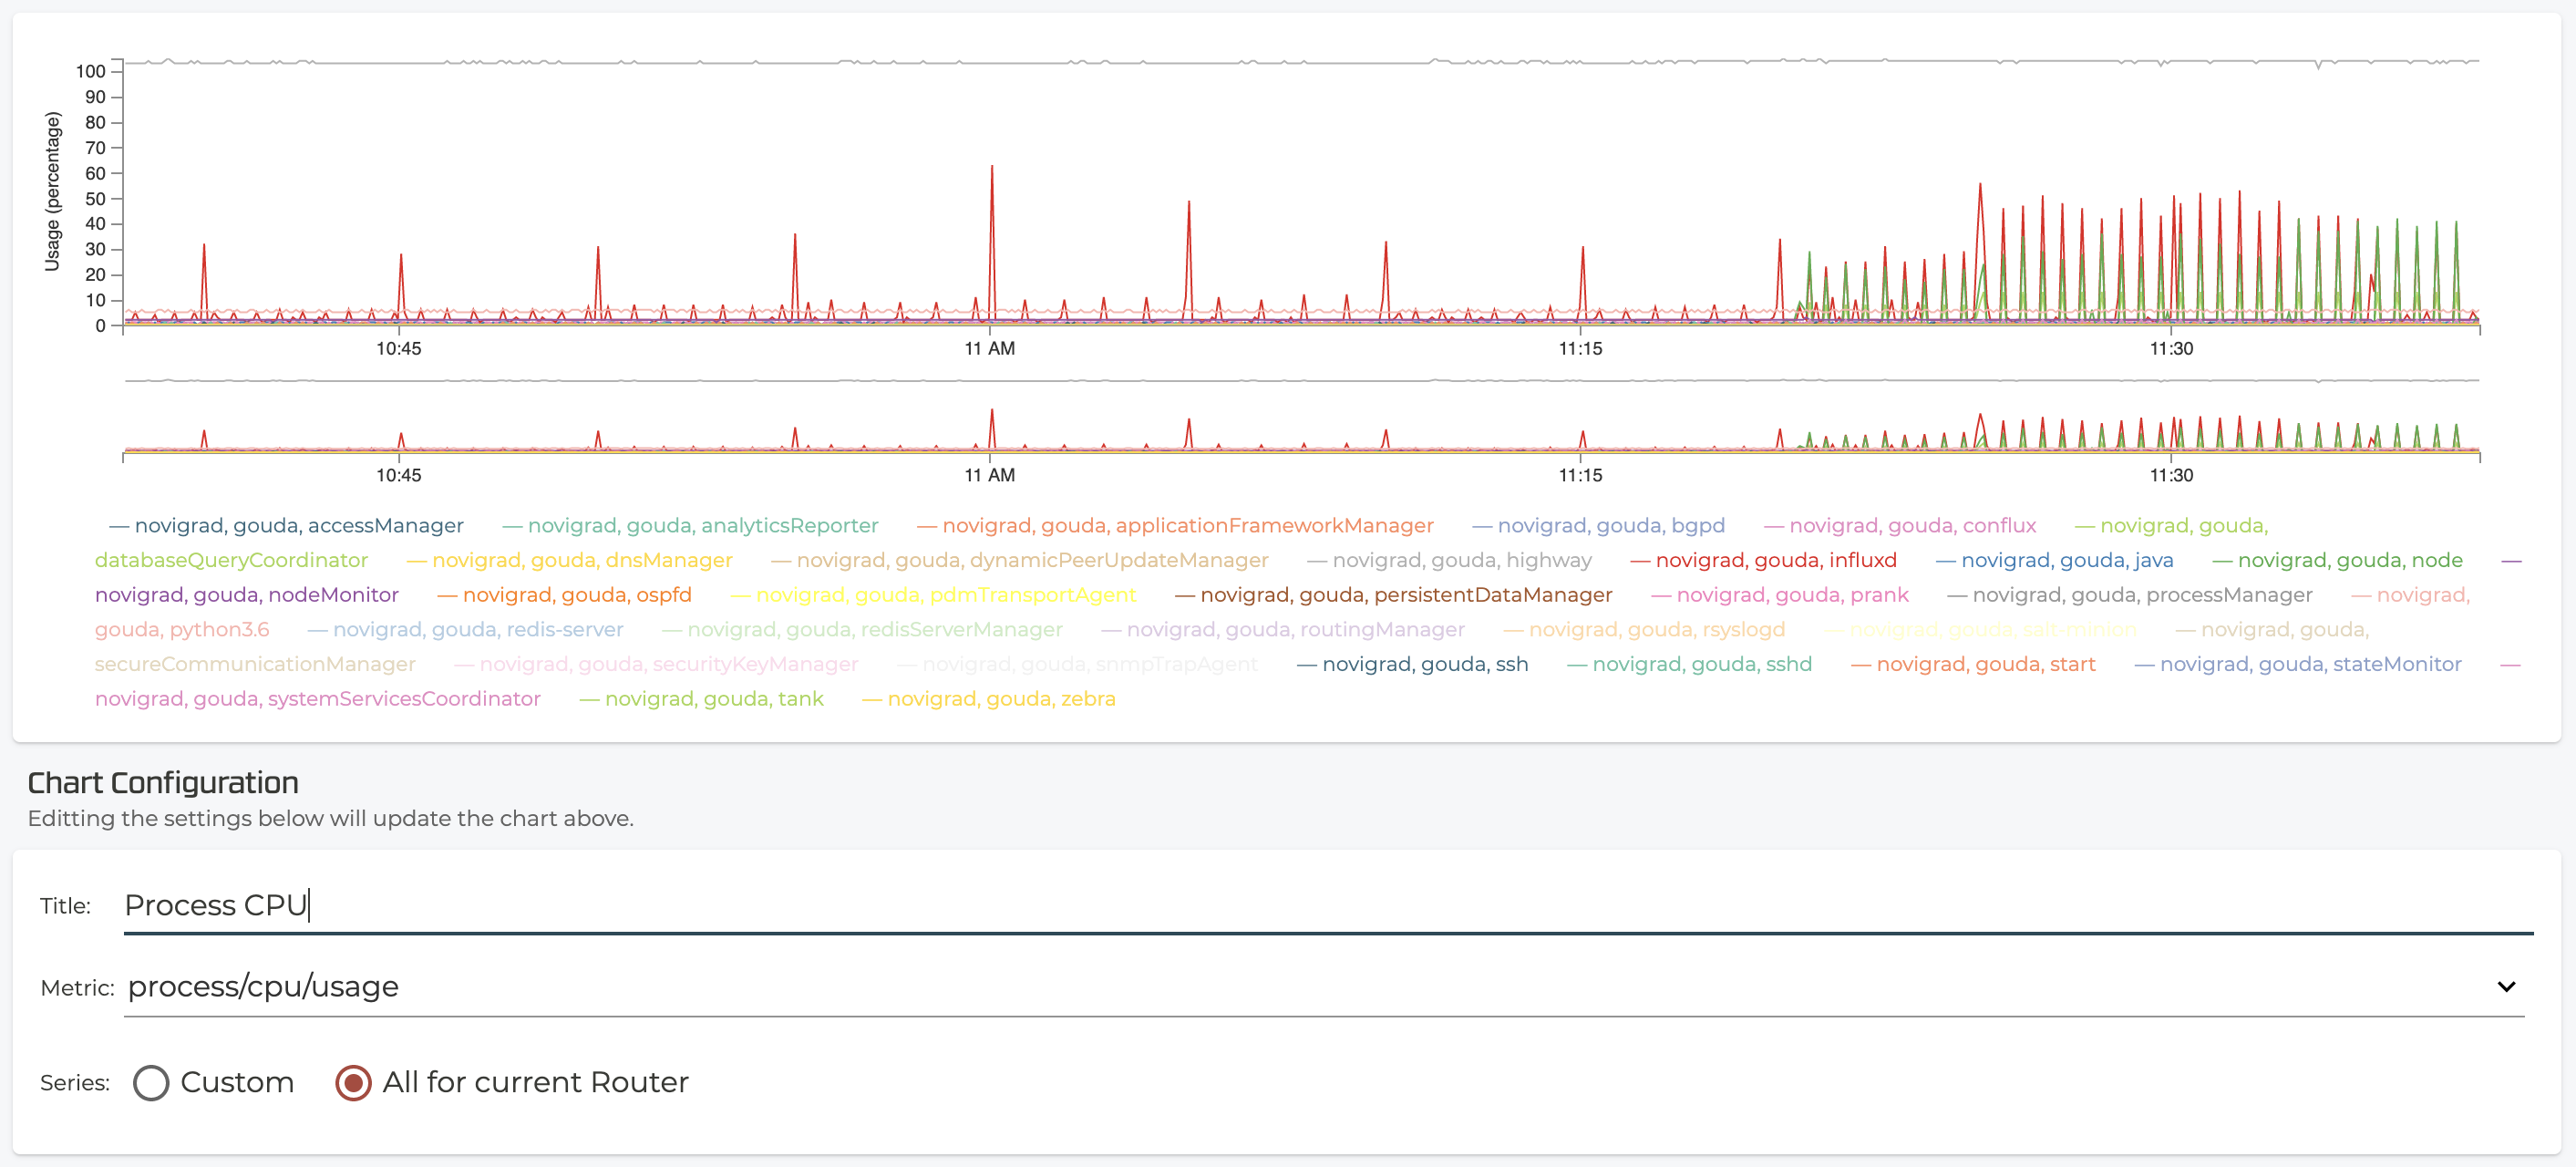
Alarms are optionally overlaid on top of all charts generated by the SSR. This is very helpful in correlating system events to system behavior. The time window of custom reports can be extended from 5 minutes to 6 months. If you see CPU anomalies that correspond to a particular application, the system may not be performing properly.